Sigma SLP: Software for Lightning Performance
Sigma SLP is a simulation software for the computation of transmission and distribution line lightning performance (number of outages to expect), with special reference to the application of line surge arresters (LSA) without and with external gaps. A Monte Carlo statistical method, along with a three-dimensional electro-geometric model is used. The software does complete modeling for electromagnetic transients simulations. The user specifies only readily available data like: line geometry, arrester catalogue data, number of towers in the simulation section of line, insulation critical flashover voltage, etc.
Some of the Sigma SLP characteristics are:
- Automatic software-driven installation of LSA – no need for user input, in order to optimize line lightning performance improvement.
- Shielded and unshielded single or multi circuit lines can be simulated. Each three-phase system can have different voltage level.
- For multi circuit lines, multi circuit outages are directly obtained. Unbalanced (differential) insulation can be simulated.
- Phase-to-tower and phase-to-phase flashovers using a leader propagation flashover model can be simulated.
- Surge arrester data is taken directly from the arrester database.
- Statistical representation of surge arresters currents, energies and charges.
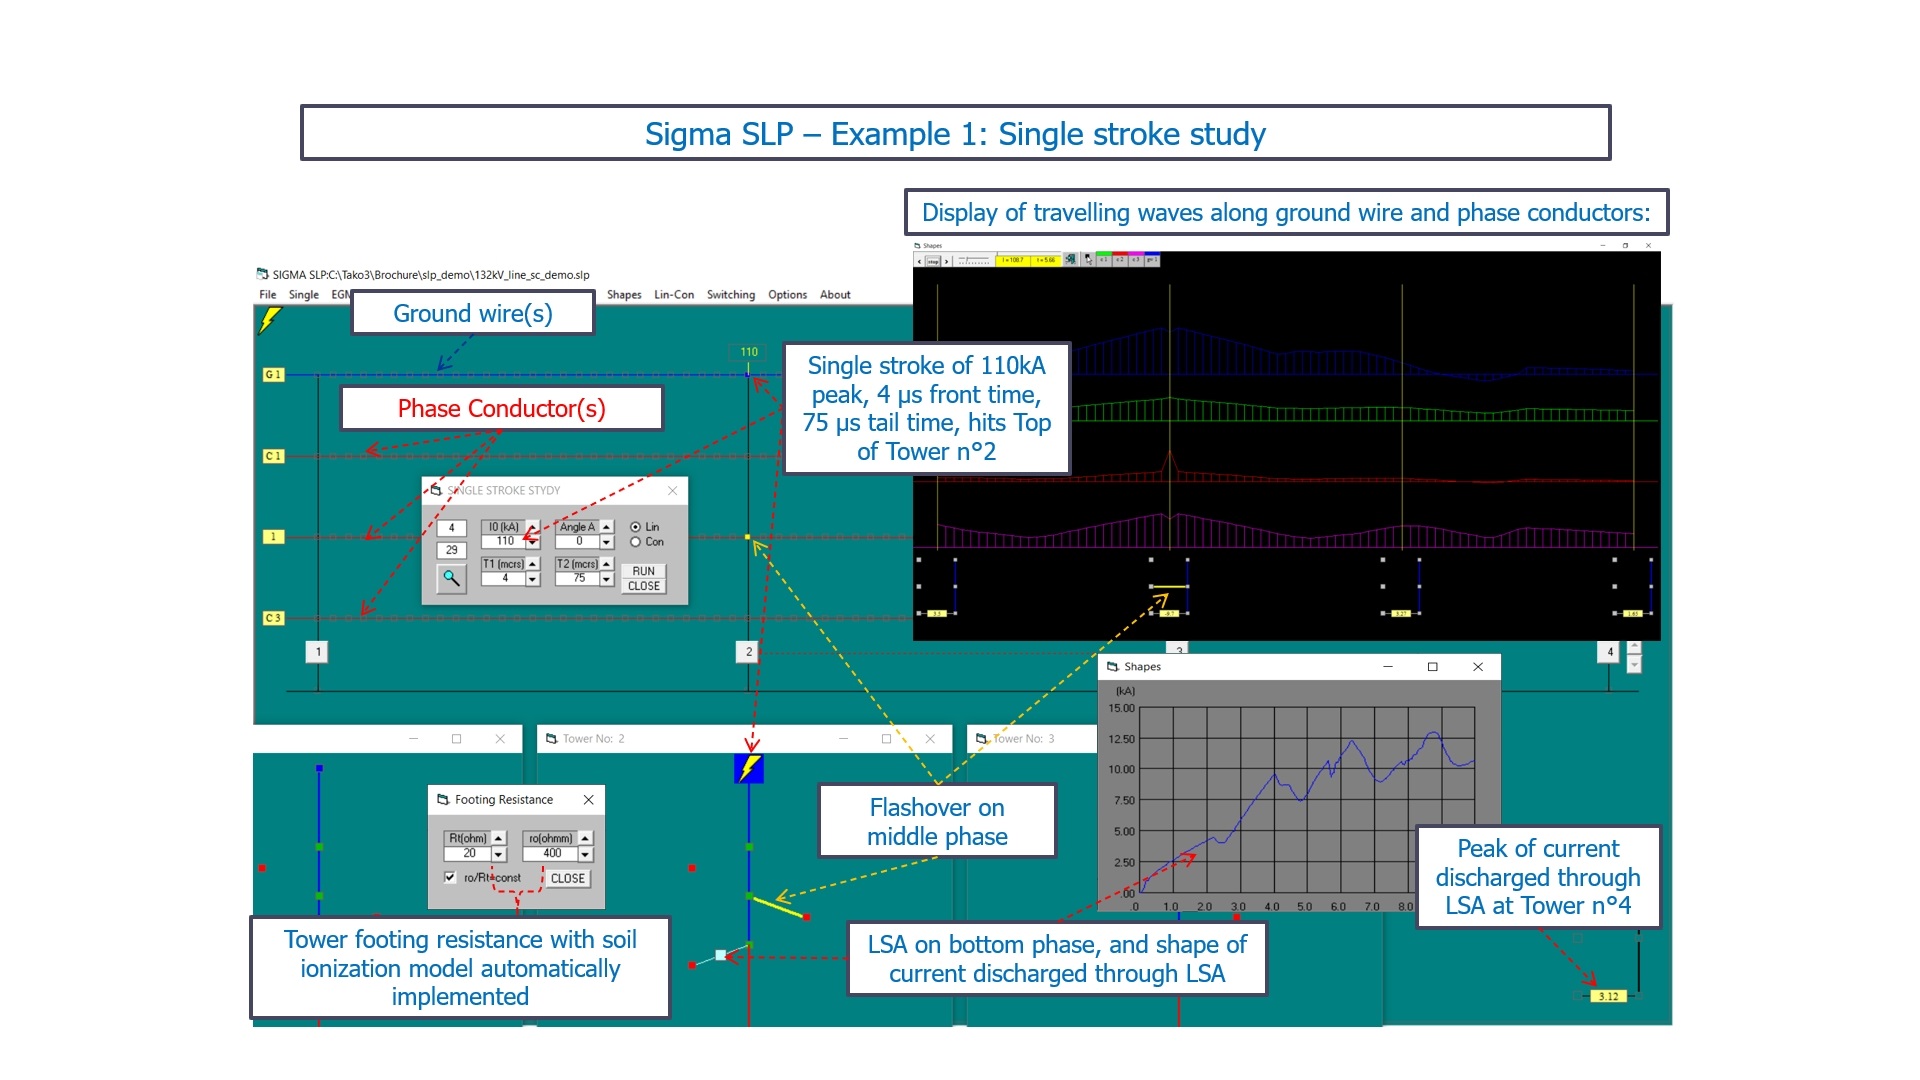
- Soil ionization tower footing resistance model is automatically implemented. Counterpoise or constant resistance tower footing model can be used.
- Transients on the tower top, guy wires with a separate grounding, under built ground wires and neutral conductors can be represented.
- Display of travelling waves along phase conductors and ground wires.
Case study: Multiple studies
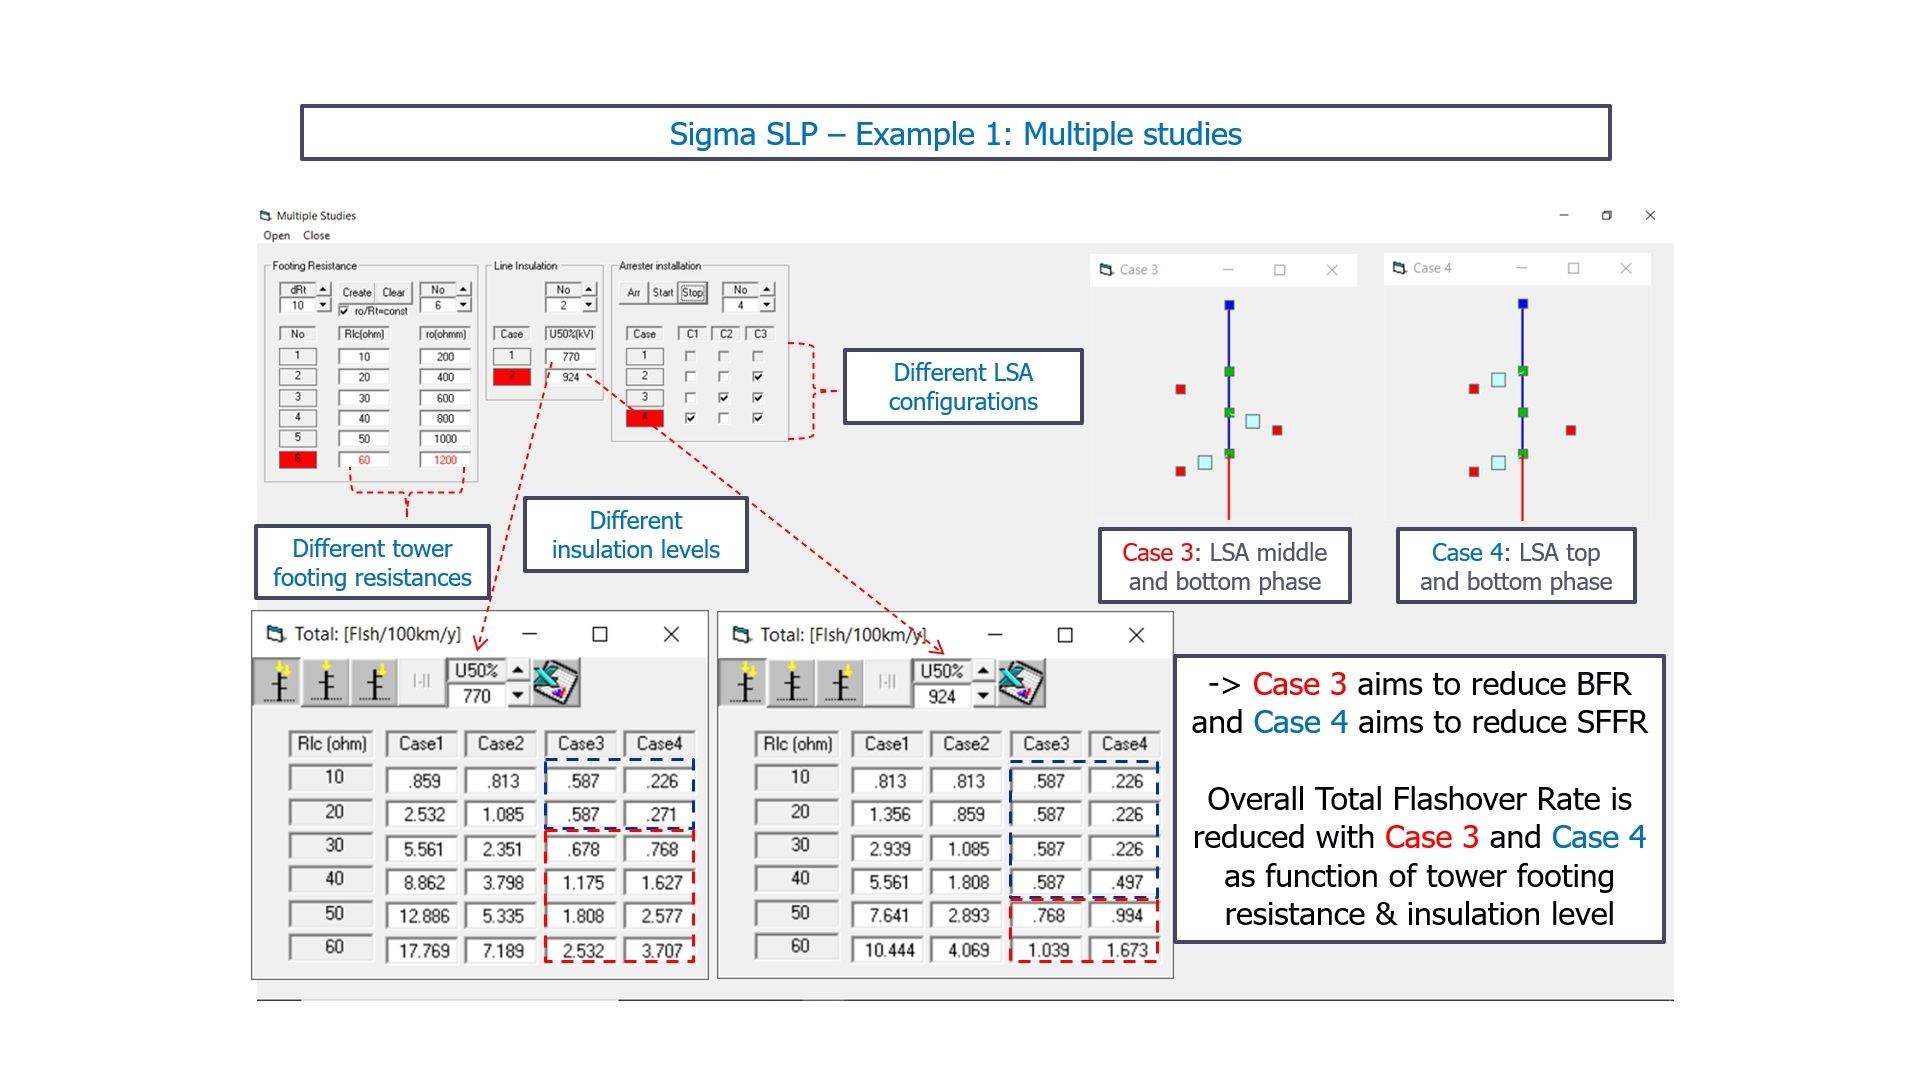
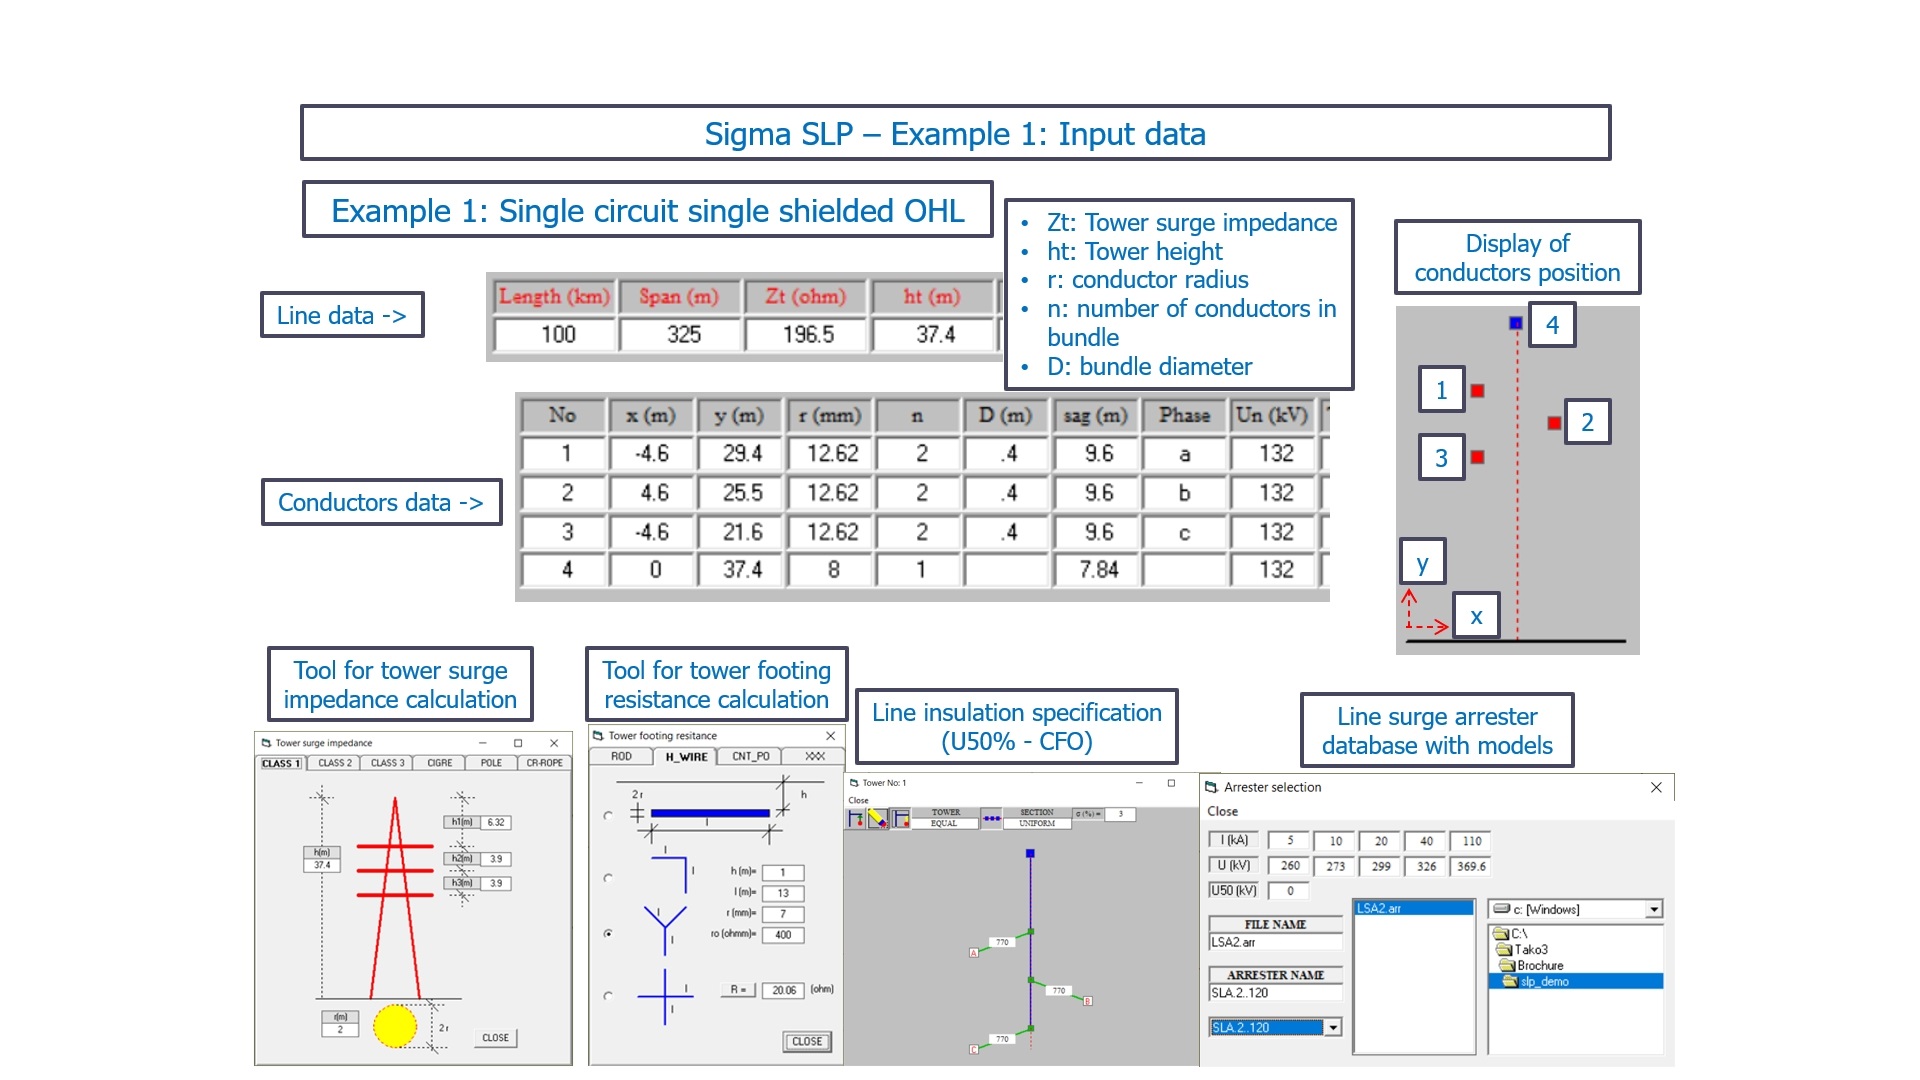
Single shielded one circuit OHL (132kV) is studied with Sigma SLP is order to compute lightning performance as function of:
- Tower footing resistance
- Insulation level (U50% – CFO)
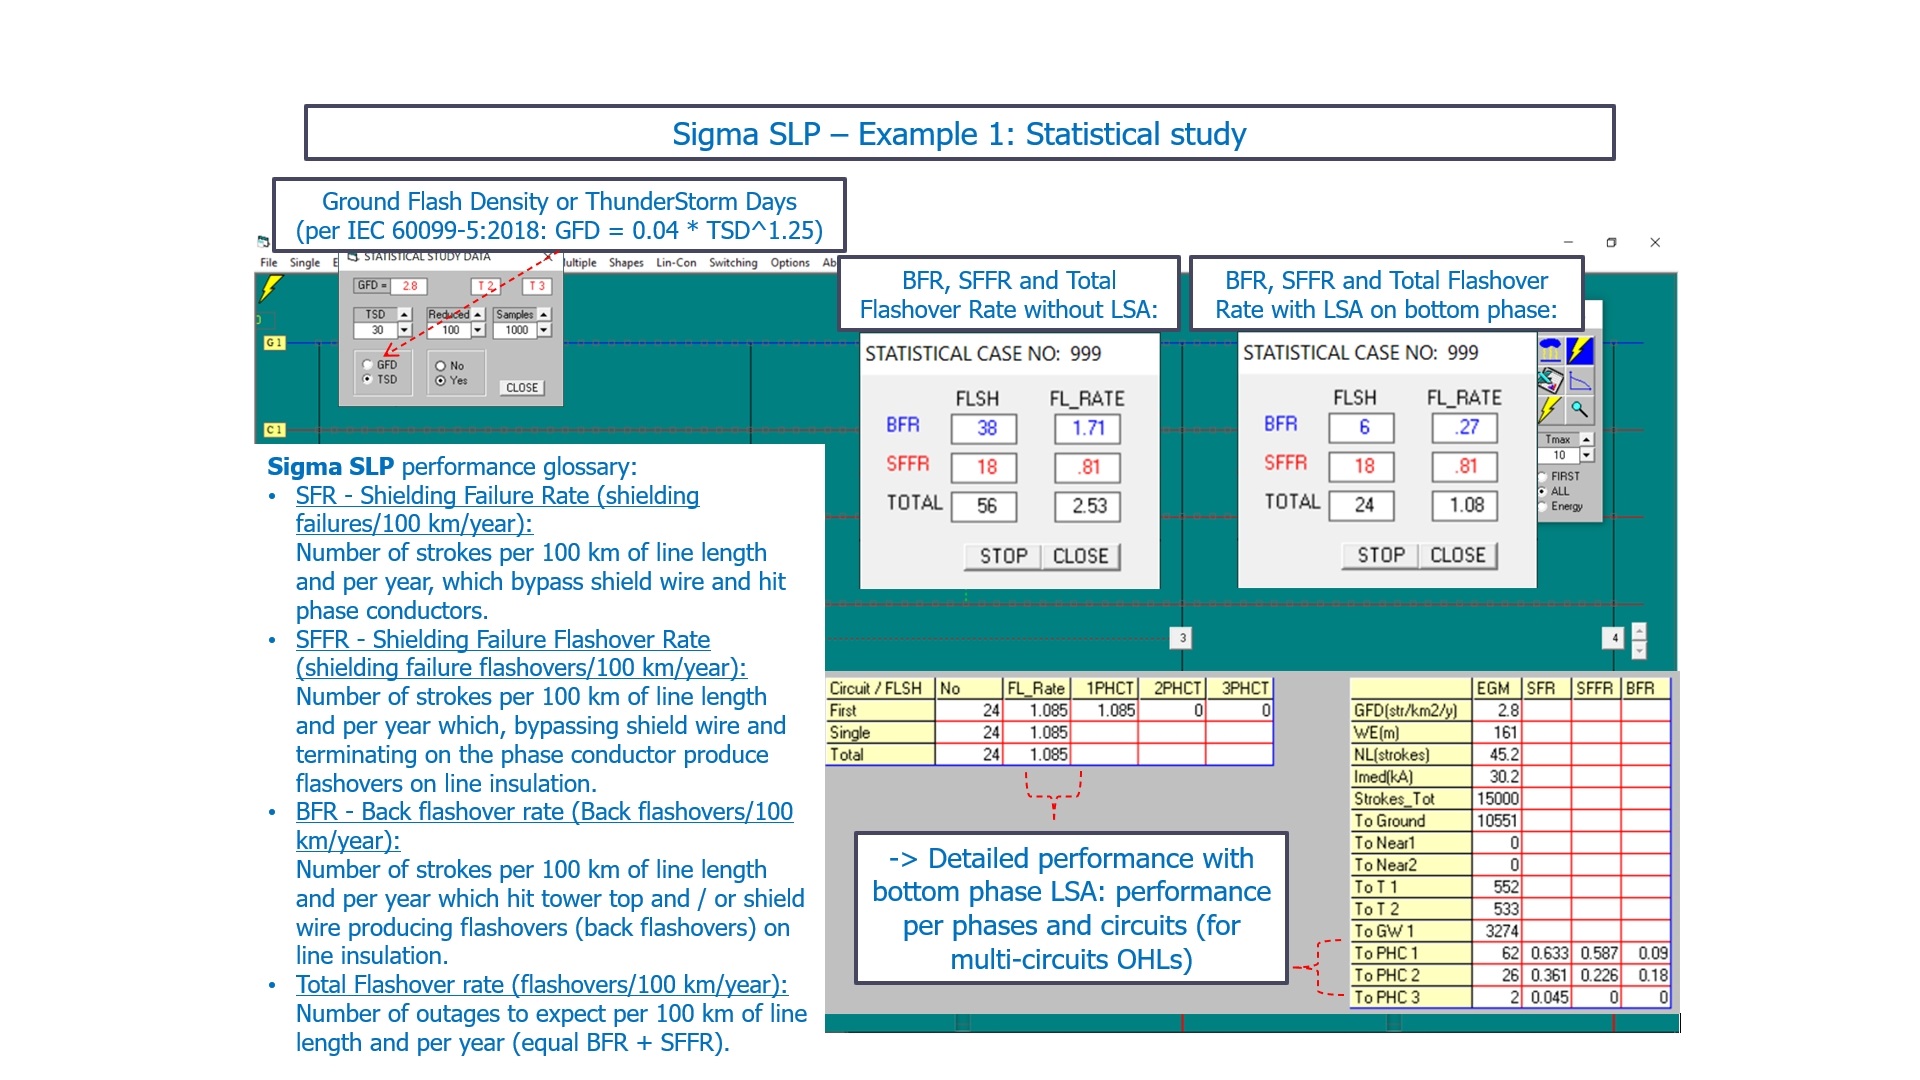
- Application of LSA to different phases
Overall Total Flashover Rate is reduced with Case 3 and Case 4 as function of tower footing resistance & insulation level.

Case study: Automatic LSA placement optimization
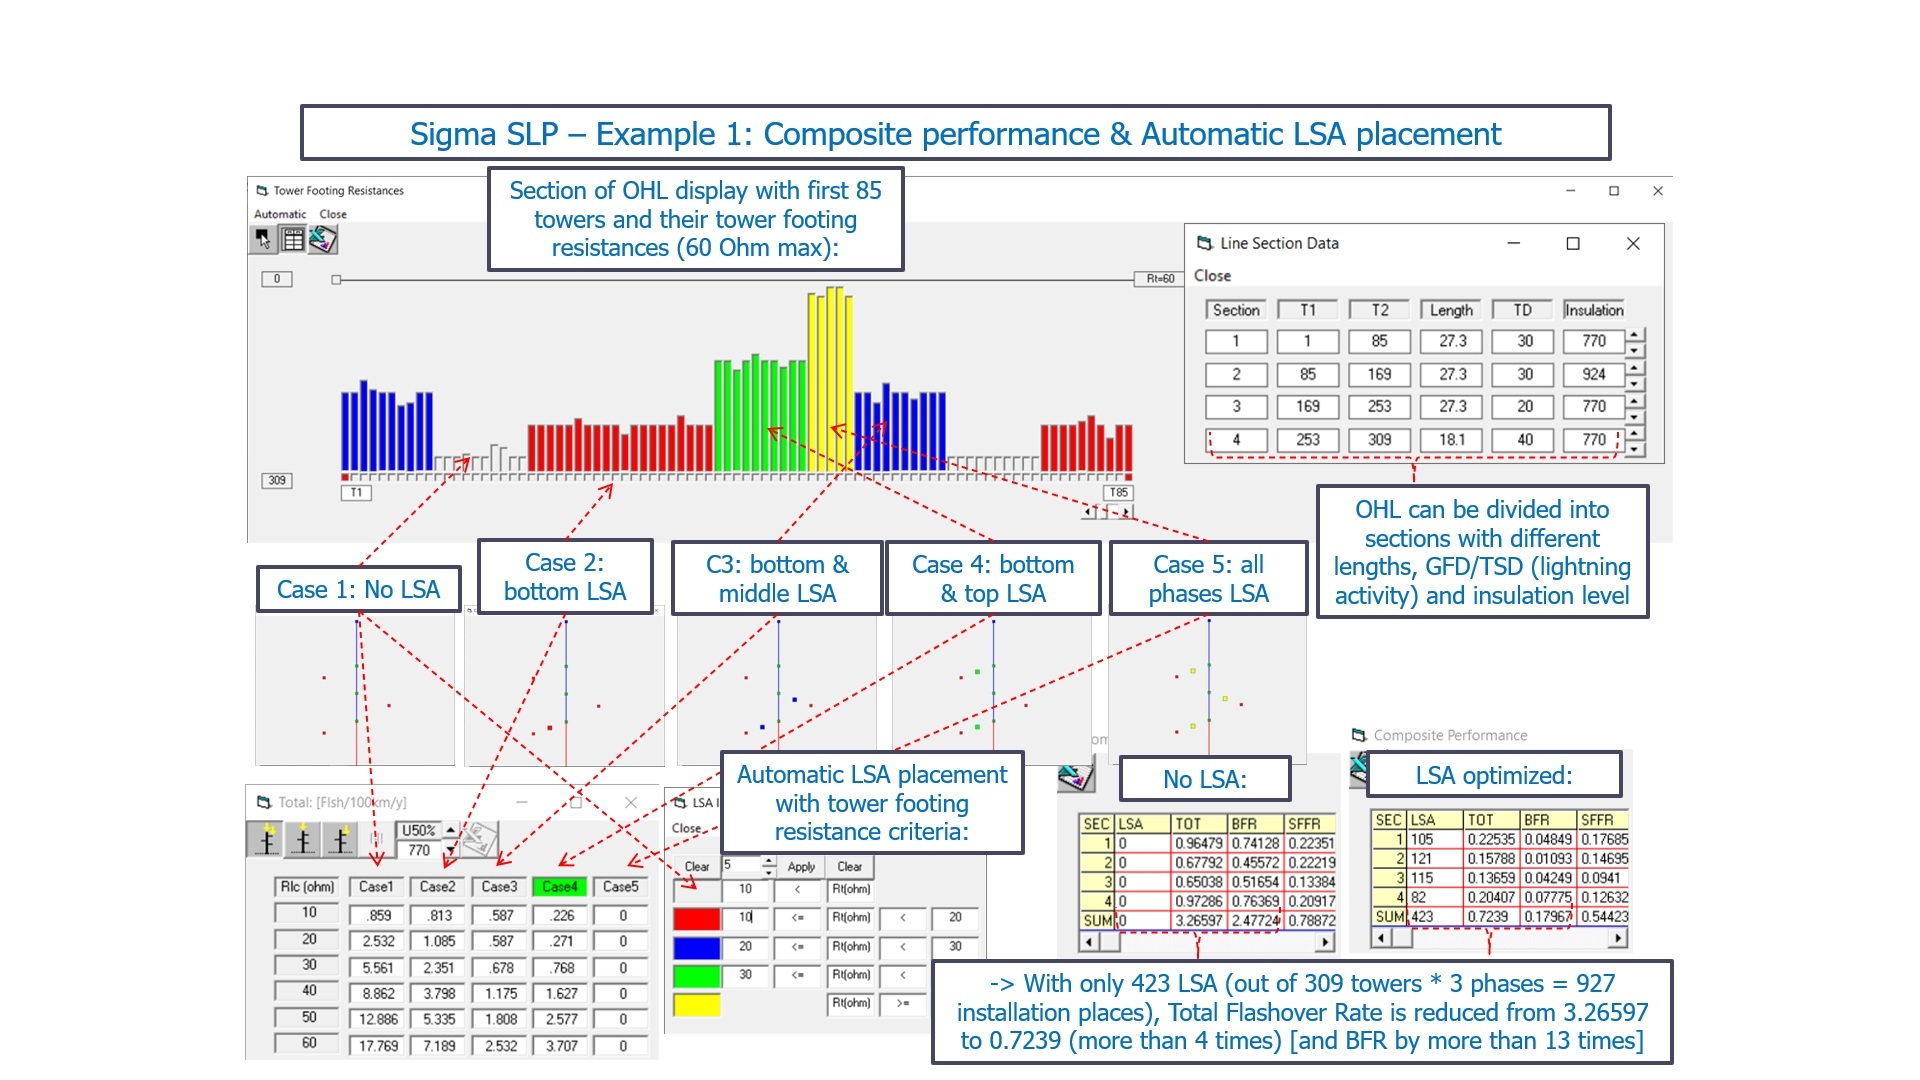
Automatic LSA placement tool is used with tower footing resistance criteria on the real OHL data (total number of 309 towers, different spans lengths, different tower footing resistances of each tower).
Different cases for each tower include no LSA to install at all (grey color), LSA on bottom phase (red), LSA on bottom and middle phase (blue), LSA on bottom and top phase (green), LSA on all three phases (yellow).
With only 423 LSA (out of 309 towers * 3 phases = 927 installation places), Total Flashover Rate is reduced from 3.26597 to 0.7239 (more than 4 times) [and back flashover rate by more than 13 times].
